


15 Most Important SEO KPIs You SHOULD Be Tracking

You might think that planning and executing an SEO campaign is the tricky part, but the job doesn’t stop there. You need to be able to track the success of any SEO efforts you have to learn from your mistakes and refine your strategies. That way, you can continually improve on your next campaign.
The best way to track your SEO success is by focusing on specific Key Performance Indicators (KPIs). There are a lot of SEO metrics you can use, but not all of them will be useful for you. Good KPIs will be useful to you at all stages of your campaign, including while it’s active to show you early warning signs.
Want to know what SEO KPIs you should be tracking?
Check out this guide to some of the most critical success markers.
15 SEO KPIs You NEED To Know
Here is a starter list of the 15 most important KPIs you should be tracking for your SEO campaigns:
- Organic Sessions
- Keyword Rankings
- Leads/Conversions
- Bounce Rate
- Pages/Session
- Average Session Duration
- Page Load Time
- Top Exit Pages
- Crawl Errors
- Search visibility
- Links
- Organic CTR
- Branded traffic
- Cost per click
- ROI
Monthly SEO packages 📅
Give us your site or clients and we’ll get to work on improve organic traffic. We’ll audit the site, then create a content strategy and build links that will move the needle… every month.
What is a KPI?
Search Engine Optimization (SEO) KPIs are specific metrics used by marketing professionals to measure the performance of their website for organic search results. These SEO metrics help pros to really understand their campaign performance, track changes, and stay on top of how algorithm updates affect their websites.
In our experience, the following 15 SEO KPI examples will give you the best overall picture on the state of your website’s search marketing efforts.
1. Organic Sessions
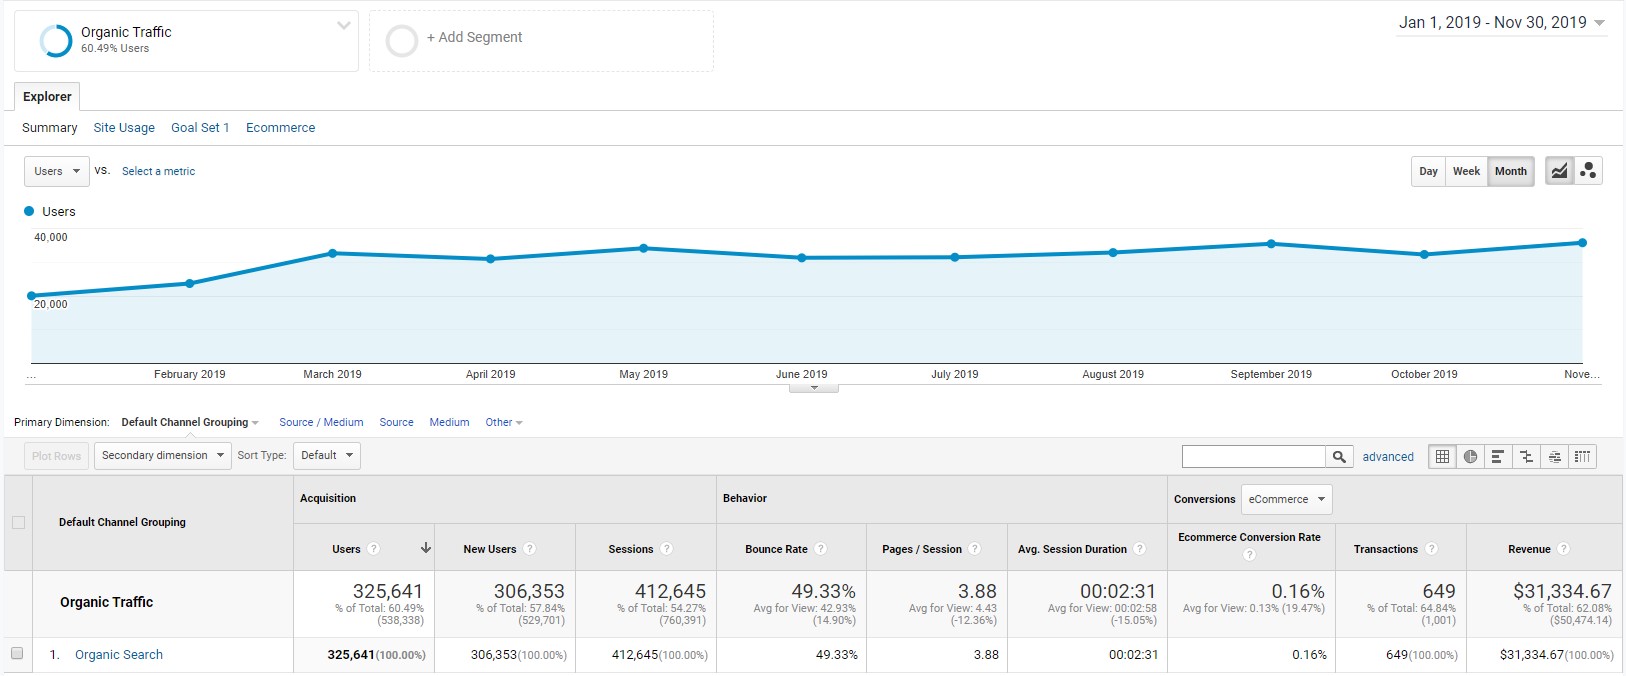
Organic sessions is one of the most central metrics you should be measuring to determine your website performance. It shows you how much traffic your website gets on any given day, and over time (weeks, months, etc).
If you see a drop in sessions, that’s a good indicator that something is wrong and needs to be fixed. Meanwhile, if you see a steady increase over time — especially after you launch an SEO campaign — that’s a good general indicator of success.
Google Analytics is arguably the best way to see your website’s organic sessions. You can find it by going to Acquisitions > All Traffic > Channels to see how your organic sessions compare to your paid, social, direct, and referral traffic.
2. Keyword Rankings
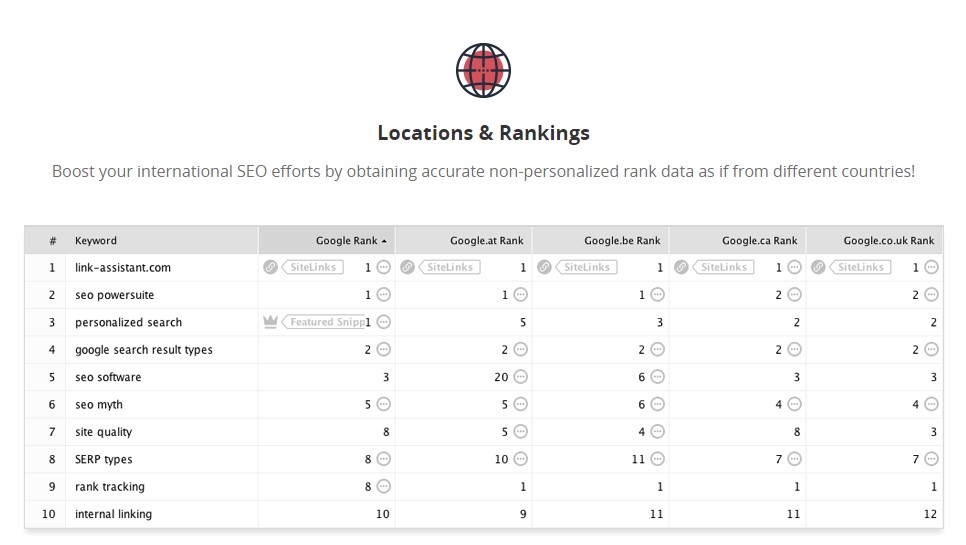
There is a strong correlation between your website’s position for certain terms and how much quality traffic you get. In general, when you rank high for keywords that are relevant to your business, you will get more relevant organic sessions. If you rank poorly, you likely won’t get nearly as much traffic as you could.
There are many useful tools you can use to track your rankings for keywords you identify as the most important to your business. Ahrefs, Link-Assistant’s Rank Tracker, and SEMRush are three of the best you will find. They will show you keyword rankings for both organic and local SEO.
With all of them, you generally add the specific keywords you want and then the locations or search engines you want to check. The tool will then scan those locations and search engines to tell you where your website ranks in the SERPs for those keywords.
You can then run, or set up automated checks at certain intervals, to see how your SEO campaign helps your rankings over time.
3. Leads/Conversions
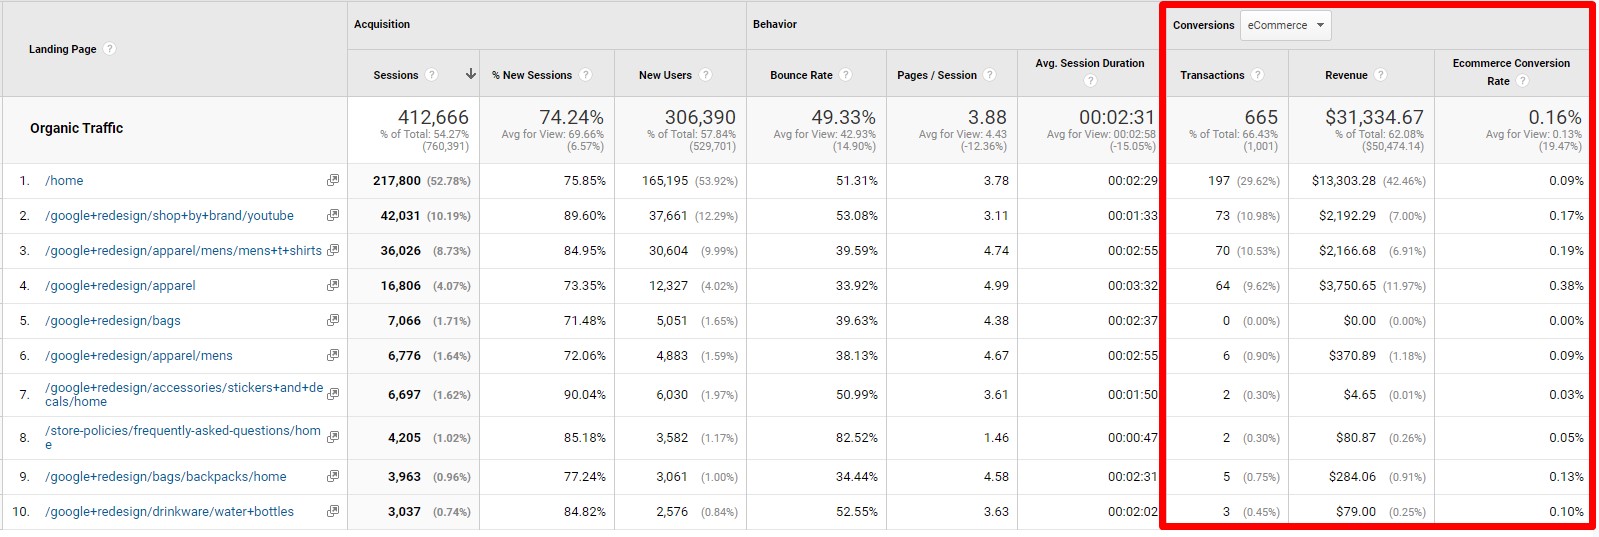
Leads or Conversions is arguably the best simple metric to track how successful your SEO campaign is once a user has landed on your site. In general, you want to set up your website so people convert to a sale (for eCommerce) or submit a lead. The lead could be to book an appointment, sign up for a newsletter, call your tracking number, and so on.
The best place to track this is in Google Analytics, though it requires you to set up goals and events in the settings. These will be triggered whenever someone submits a lead or converts on your website, which will then appear in the Conversion section of your Google Analytics reports.
4. Bounce Rate
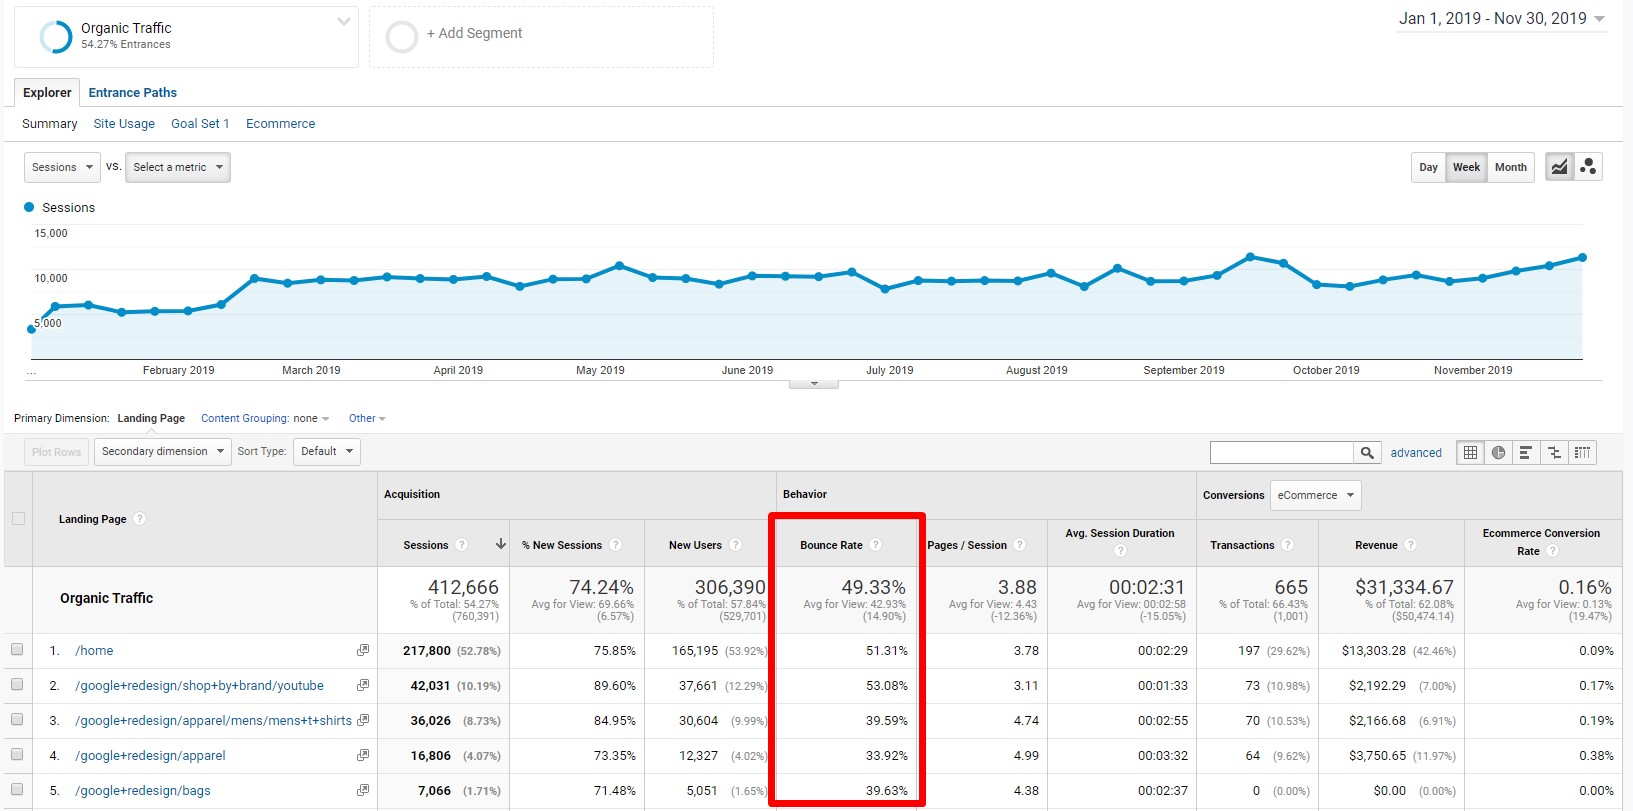
The Bounce Rate KPI shows you how often someone leaves your website without doing anything — clicking on a second page, submitting a form, and so on. It is a good general indication of how relevant and helpful people find your page after clicking on it in an organic search result.
A high bounce rate means that people are likely leaving your website because they didn’t like your page or its content. That’s a good indication that you should work on improving that page’s content.
You can check the Bounce Rate of your website’s various pages in Google Analytics. Go to Behavior > Site Content > Landing Pages, filter to organic traffic, and check the Bounce Rate column in the report.
5. Pages Per Session
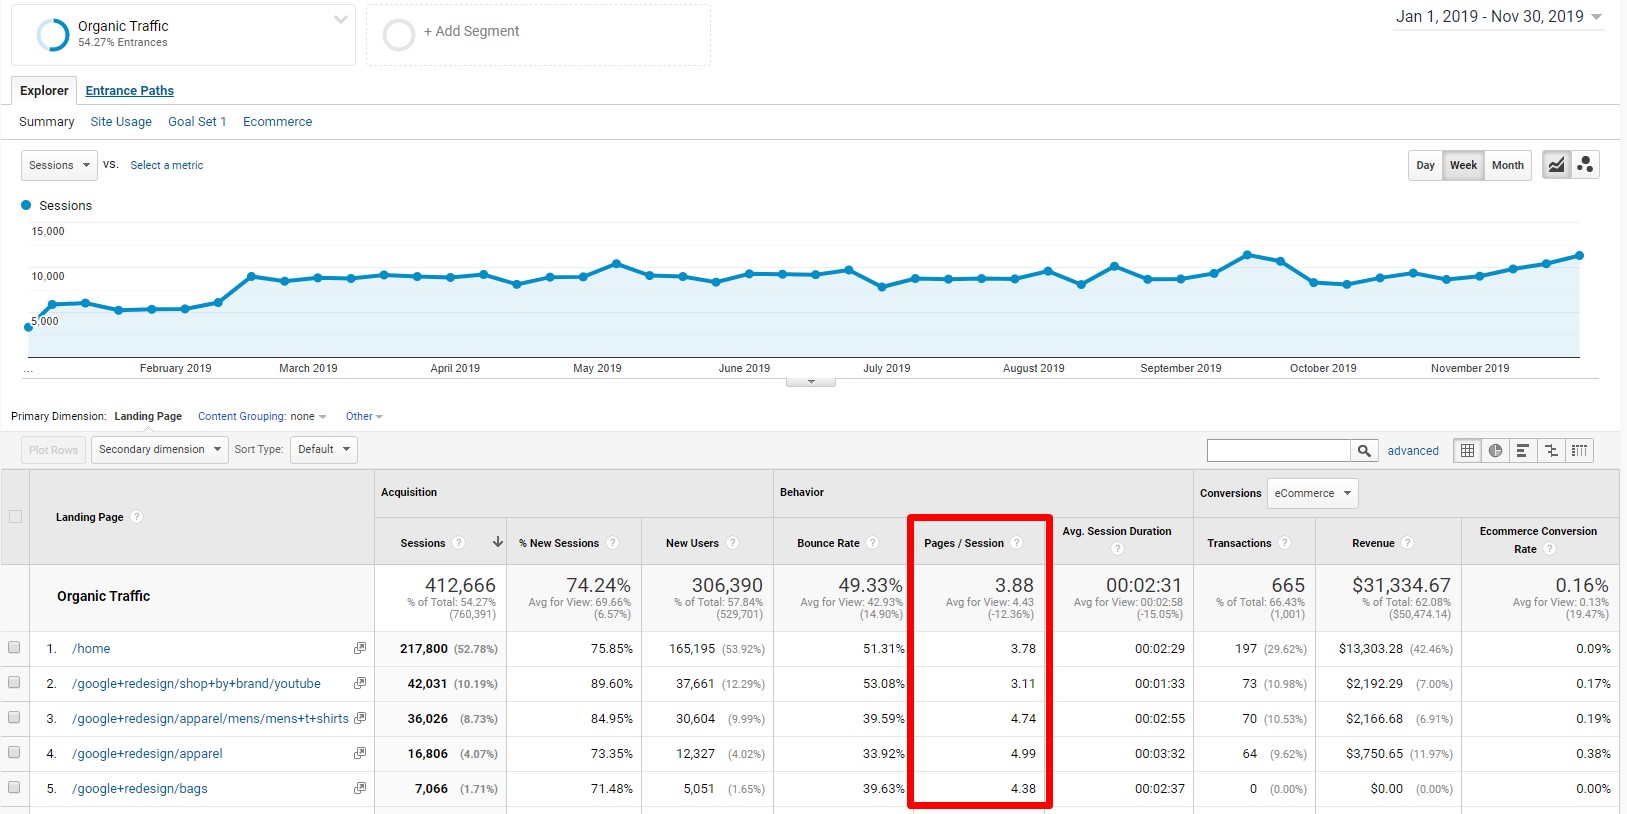
Pages Per Session is a behavioral metric similar to Bounce Rate, but it tells the opposite story. If your website or a specific page is thriving in an organic search campaign, it should generally have a high amount of pages per Session.
This is because the user found that they wanted to know more about the information, products, or services you had to offer. As a result, they keep clicking on more pages on your site to learn more. In general, the more pages they check, the more genuinely interested in you they are.
You can find this metric in your Google Analytics account in the same place as Bounce Rate; in fact, it is usually listed right beside it.
6. Average Session Duration
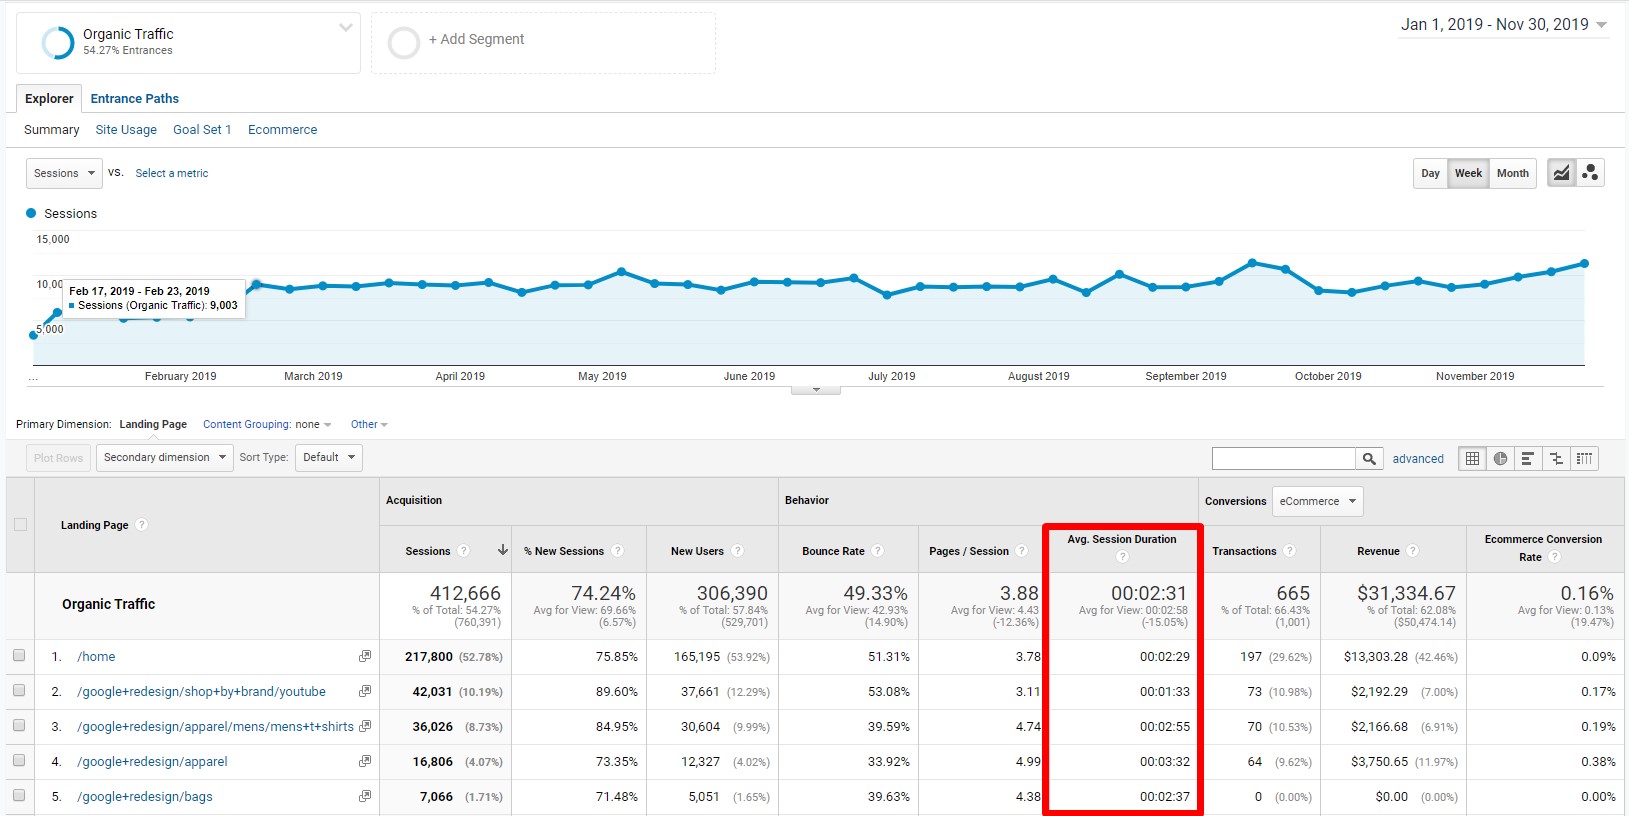
Average Session Duration is another useful KPI to give you insights about the behavior of users once they get to your website. If you have a high Average Session Duration, people are likely spending a lot of time digesting your content, clicking on other pages, and researching your products or services.
If you have a low average duration, you likely have a problem: content is too short or not interesting enough to convince them to stay on your website. You can find this metric in the same location as Bounce Rate, under an adjacent column.
7. Page Load Time
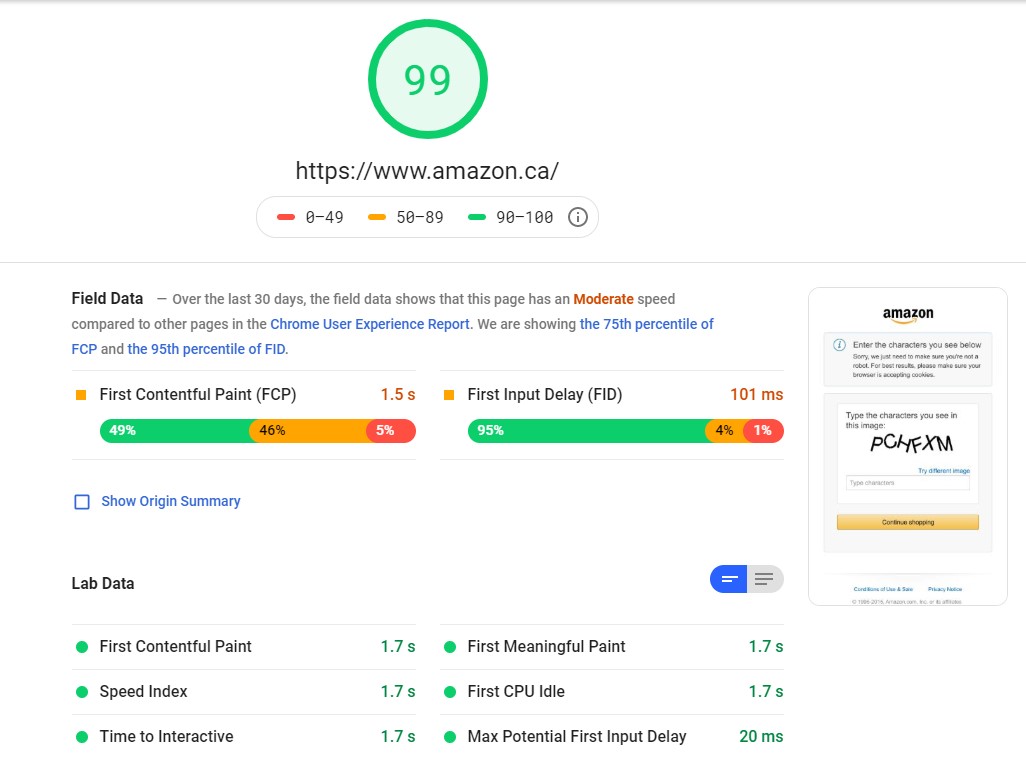
Page Load Time is a significant metric that is taken into account by search engines when their algorithm determines its rankings. There’s also a strong connection between how fast your website’s pages load and how likely a user will convert.
In general, people are more likely to leave your site if it takes too long to load — especially on mobile, where sites tend to load slower. Most studies into this have found that most mobile users will leave a website if it takes more than 3 seconds to load.
There are numerous tools you can use to check the page load speed. Google Analytics has a decent one for free under Behavior > Site Speed. You can also use Pingdom or Google’s Page Speed Insights tool. Both will break out the loading speeds by desktop and mobile load times, and give you insights on what is slowing your site down.
8. Top Exit Pages
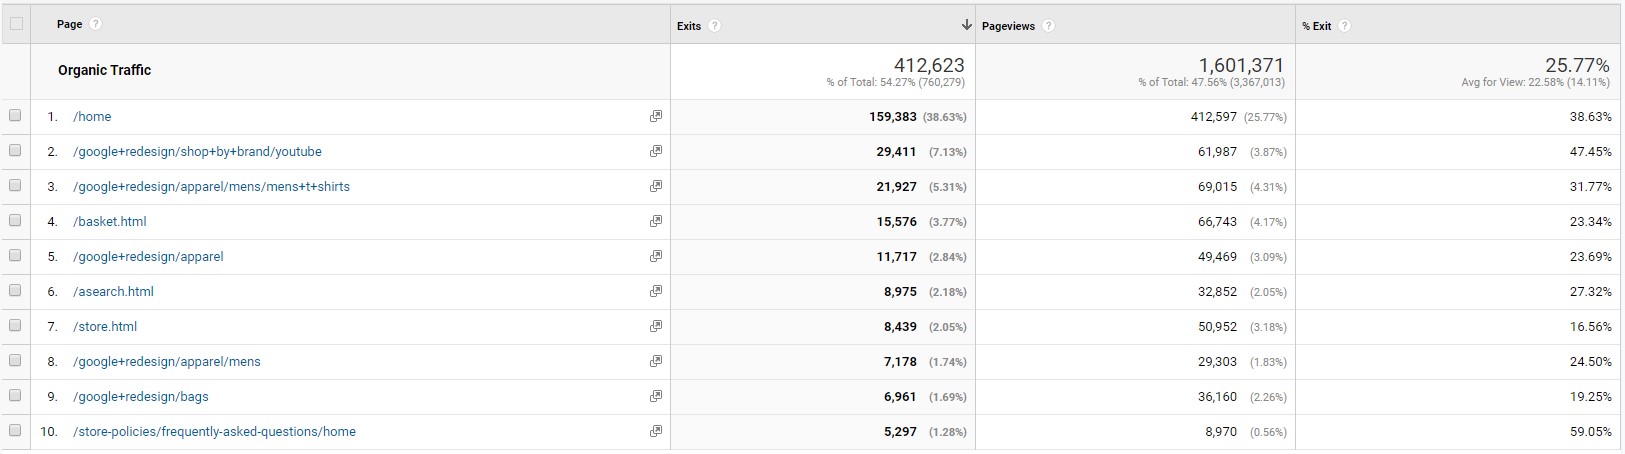
Top Exit Pages is an excellent metric to show you what the final page in a session is where the user finally leaves your site. In general, you want the exit page to be a purchase confirmation or lead submission thank you page.
You don’t want to see your home page or any information or service page where you don’t want people to leave. If you have pages that are meant to funnel people to a conversion page with a high exit percentage, that’s a good sign you need to work on revamping it.
You can find each page’s exit rate in Google Analytics under Behavior > Site Content > Exit Pages. Make sure you filter to organic traffic to strip away any paid, referral, or direct traffic.
9. Crawl Errors
All search engines and major SEO tools will use crawlers to quickly scan your website for its content, technical set up, and more. Their algorithms then assess the quality and relevance of your website according to a specific search being performed.
The last thing you want is to have multiple crawl errors occur, when some problem is preventing these crawlers from checking your site. If they cannot do so, they will completely ignore your site for that search.
There are numerous reasons why a crawl error might happen. The best place to check your website’s crawl errors is with Google Search Console. It will show you the number of errors as well as the reasons for each one.
10. Search Visibility
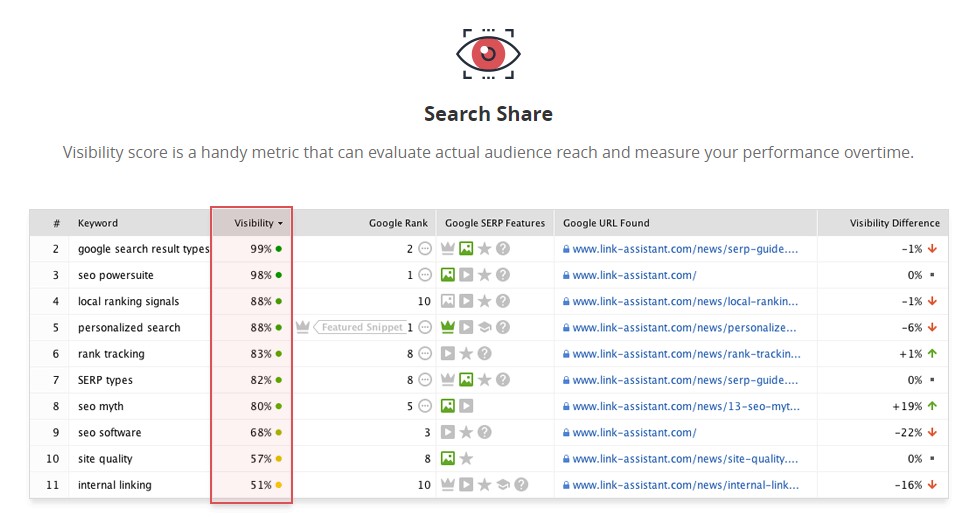
Search visibility, or ‘search share’, refers to how often your website appears in the search results for your target keywords. This can help you track how many impressions your website can get in any search that uses your relevant core keywords. You can use it to see how much you dominate the share of search results.
The same tools you can use for keyword rankings will also offer some kind of search visibility metric. However, if you don’t want to pay for a tool, you can also set up a free Google Search Console account and use their Total Impressions score under the Performance report.
11. Links
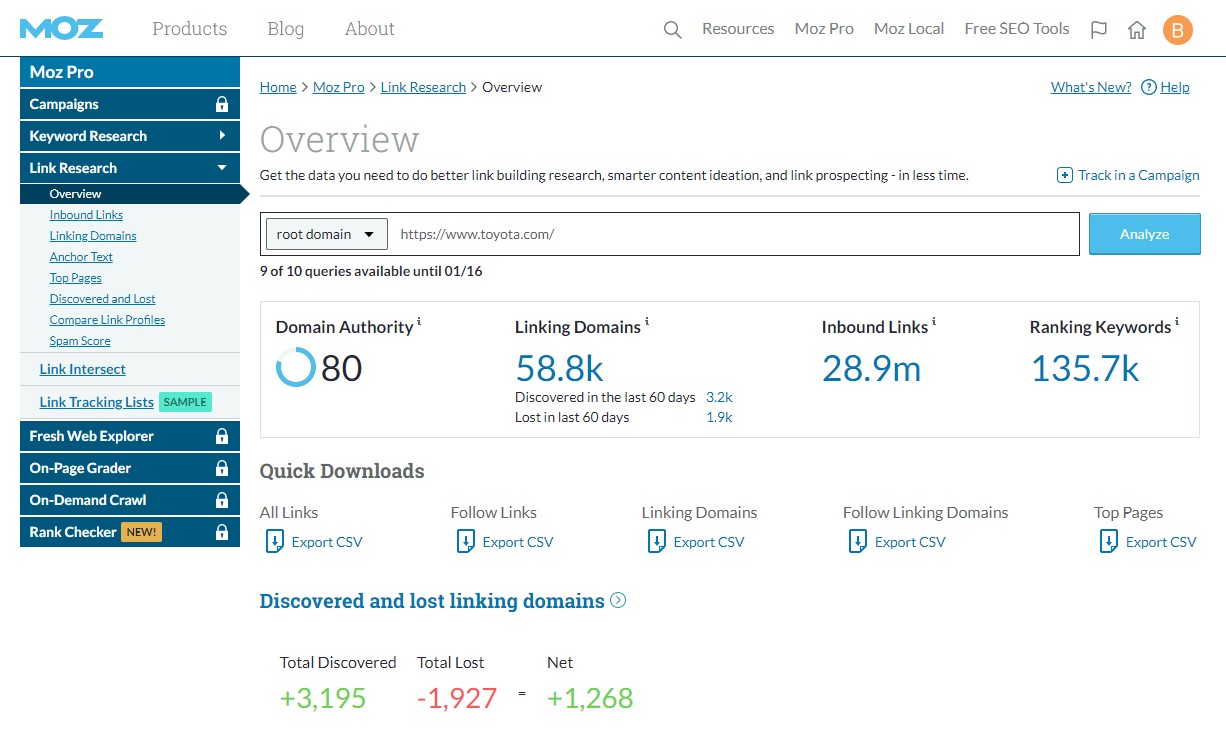
Since the beginning of search engines and SEO, links have been a foundational element for algorithms to determine rankings. The general rule is that having more links, relevant links, new links, and so on will help improve your website’s rankings in search engines.
All of the most prominent full-service SEO tools will include a link report to show you various metrics on your website’s link profile. Moz’s Link Explorer, Ahrefs, Majestic SEO, and others will show you total links, linking domains, anchor text, linked pages, and more.
If your SEO campaign is including link building, you will want to be including links as one of your main KPIs. It will give you the best complete picture to track your success.
12. Organic Click-Through-Rate (CTR)
Having good keyword rankings and search visibility only tells half of the story for your SEO campaign. The other half is how often the pages you have ranking are getting clicks and traffic. That’s where Organic Click-Through-Rate (CTR) comes in.
It measures how often someone clicks on your website when it appears in their search results page. If you have a high Organic CTR, it’s a good indication that you set up the page precisely right. Your meta titles and descriptions are speaking to their needs and drawing them to click.
Google Search Console’s Performance report is the best tool to track your Organic CTR. It’s free, and it will show you the CTR by a specific page, in particular locations, and by desktop or mobile. You can also use tools like SEMRush and their Analytics report.
13. Branded Traffic
Branded traffic refers to how much of your website traffic you get from people searching for your business’ name. This metric is a great way to track the effects of any branding campaigns you have, as people have to already know your business name to search for it.
You will also often find that you get more branded traffic when you are running any type of campaign. Some people will see your ads or website, and will search for your business later. Not everyone will have the time and inclination to look into you in more depth right away.
You can track your branded traffic in Google Search Console by adding your business name into the keyword filter of your Performance report.
14. Cost Per Click (CPC)
In general, you won’t have a direct cost associated with an SEO campaign like you would with a paid campaign. However, that doesn’t mean that you did not spend anything on your campaign. You might have paid an agency to generate backlinks or write SEO content.
You can calculate your Organic CPC by adding your total SEO budget per month and divide it by your total organic traffic per month. If your SEO campaign is successful, you should see your monthly CPC go down over time.
15. Return On Investment (ROI)
Another KPI to track the overall worth of your SEO campaign compared to how much you spent on it is your ROI. You can calculate this using the following formula:
Total up your revenue generated from organic traffic per month.
Total up your total costs for your SEO (agencies, copywriting, any SEO tools you subscribe to, etc.)
Subtract the total from Step 1 by the total from Step 2.
Divide the result of Step 3 by the total from Step 2.
A successful campaign should see your monthly ROI be positive every month after its completion. It’s not unusual to see the ROI be a negative percent to start, as you will likely not see a large amount of revenue generated immediately.
Summary
It’s very important to use KPIs to properly track the performance of your organic campaigns. Without them, you will not be able to spot any problems early before they turn into significant issues. You won’t be able to diagnose a problem and see how you can fix them. You will also be unable to tell if the money you are spending to improve your SEO is actually valuable.
Using these KPIs and the tools to track them, you will be able to get a complete picture of the success of your efforts. That way, you can learn from your mistakes and always improve your strategies over time.
Hand off the toughest tasks in SEO, PPC, and content without compromising quality
Explore ServicesWritten by Aaron Haynes on January 28, 2020
CEO and partner at Loganix, I believe in taking what you do best and sharing it with the world in the most transparent and powerful way possible. If I am not running the business, I am neck deep in client SEO.