


What Are Engagement Metrics?


When it comes to marketing and sales, getting new leads to your website is a major focus. While this is undoubtedly significant, increasing site traffic won’t mean much if you can’t capture visitors or nurture leads via the sales funnel. Only through engaging your visitors will you be able to attain any level of success. This is why you have a content marketing plan and a social media presence in the first place: to connect with your audience.
You will not be able to build interest until there is engagement. Because your ability to engage your audience is so crucial, you must monitor your user engagement metrics. This will help you to properly assess your ability to engage users and enhance that ability by adjusting your marketing strategy as needed.
This article will help you understand what engagement metrics are, why they are important, what the metrics for search ranking are, and how to measure engagement.
Let’s dive in.
What Are Engagement Metrics?
So, just what is user engagement?
Essentially, it is every type of engagement a user has with your brand. This might indicate a variety of things. To mention a few examples, it may be sharing a post on social media platforms (Twitter, LinkedIn, Facebook, etc), downloading an eBook from your website, joining your email list, or just spending time reading content on your website.
Why Are Engagement Metrics Important?
To build a good website and implement a successful marketing plan, a significant amount of labor (not to mention resources) is required. Monitoring these engagement indicators allows you to not only assess the effectiveness of your website and digital marketing activities but also make changes in particular areas to increase your interaction with your audience.
When used in tandem, these indicators can assist you in identifying possible issues that may be affecting user engagement. By solving these challenges, you can enhance not only user engagement but also, ultimately, increase conversion rate. You can reduce churn, enhance retention, and maximize revenue by leveraging your metrics to drive better engagement.
According to a study of worldwide marketing professionals and content strategists assessing their usage of content marketing, 51% stated that the number of leads produced was the most significant measure for measuring content engagement. For half of the marketers polled, the number of new or recurring visitors was also an important statistic.
They may tell you a variety of things about the performance of your content, but it’s critical to understand which ones track and measure content interaction.
Engagement metrics are crucial to track because they demonstrate how effectively your content is matched with your audience’s demands and interests. New users who are more engaged with your content are more inclined to share it, purchase your products and services, and remain loyal to your company. Engagement metrics are used by 79% of B2C marketers to measure the performance of their content.
By paying attention to user engagement data, you can improve the entire user experience for your target audience. You’ll notice that it becomes simpler to figure out what their inquiries are, allowing you to offer the answers they want. That being stated, here are a few pointers to assist you to obtain positive engagement indicators:
- Provide a positive user experience
Slow-loading pages degrade the user experience. Make sure that your website’s navigation is simple and that the layout is user-friendly and easy to navigate. - Create useful content
Your content must be well-crafted. Your users will not be engaged if the content is not useful or relevant to their requirements. Remember to also connect your content with the buyer’s journey. You should have content that meets the demands of your website visitors at every point of their journey, regardless of platform. - Run successful campaigns
Having an easy-to-use website surely helps with engagement. However, it is your digital marketing activities that will drive visitors to your website. After all, you can’t engage someone if there’s no traffic. Strong content marketing, social media marketing, email marketing, referral, and SEO marketing campaigns will be required for successful engagement and brand awareness.
- Make it a point to provide clear calls to action.
A strong call to action is the driving factor behind a high conversion rate. If a visitor is actively engaged, you should offer encouragement and guidance in the form of a CTA.
Engagement Metrics FAQ
What are the metrics that indicate how engaged a user was?
Identifying the quality and number of visitors to your website is crucial, but determining whether they are engaging with your website is equally, if not more, important. The following are a few key indicators to monitor to determine how engaged your website’s users are:
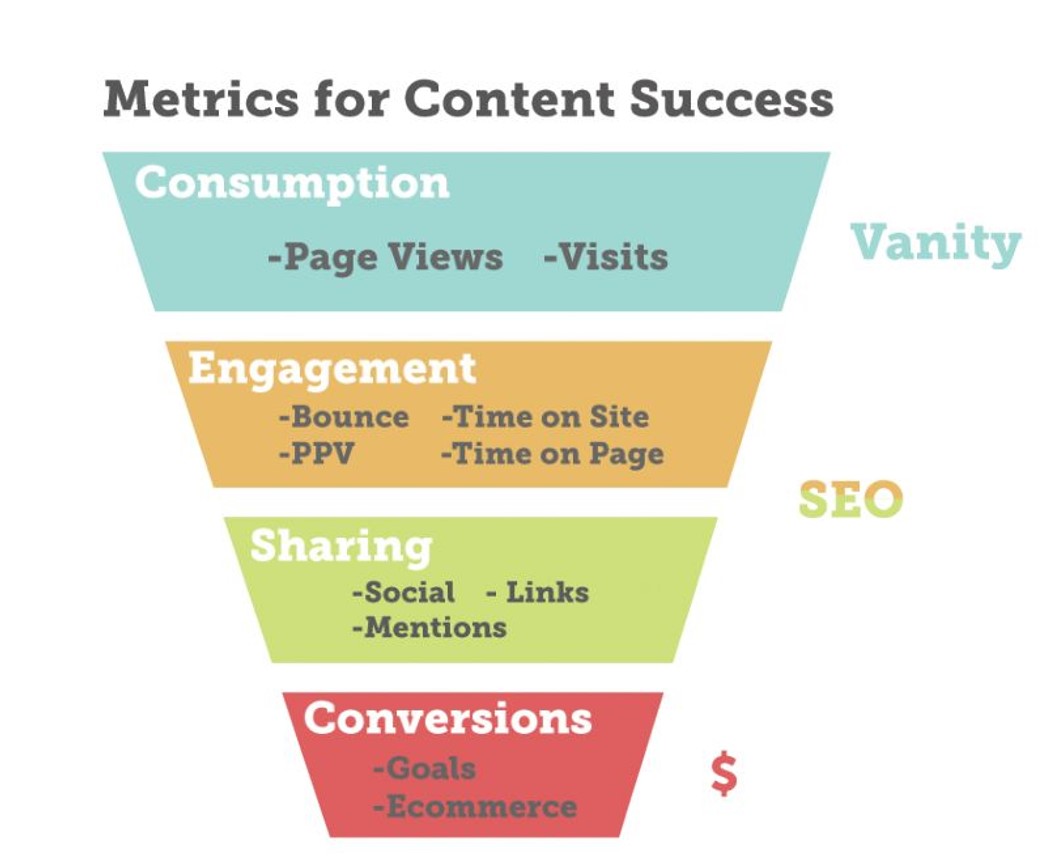
- Bounce Rate
The number of visitors that departed your website without visiting more than one page is referred to as the bounce rate. It indicates they did not participate in any manner. This is a useful statistic to use since it may offer you strong indications about any issues you may be having with a page.
For example, if a page has a particularly high bounce rate, it indicates that something is preventing visitors from engaging. It might simply be that the content is poor or irrelevant to their search, or it could be that there is a technological problem affecting the user experience (such as slow loading speeds).
- Sessions
The amount of time that people spend exploring your site, whether they stay on a single page or see many pages, is referred to as a session. The longer their sessions last, the more involved you can expect them to be. You should keep note of the average session duration. It divides the overall number of sessions within a given period of time by the total number of seconds spent on your site by all active users during that same time frame. - Pages per Session
Each session dives a bit further into the data from your sessions. It denotes the number of times a page is viewed by a visitor in a single session. You can conclude that a person who visited more pages during their session was more engaged with your site overall. It suggests that they most likely returned to your website after their initial visit, either by using your navigation bar or by following internal links.
However, it’s important to remember that a low page per session statistic isn’t always a bad thing; some people may stay on one or two pages if they’re reading substantial content and may return later to explore your site more thoroughly.
Pageviews, on the other hand, count the number of times a visitor visits a page on your website.
- Abandonment Rate
The abandonment rate refers to any conversion action that a visitor was in the middle of doing before leaving your website. For example, if someone added a product to their shopping basket on your eCommerce page but then left without checking out. You’ll want to bring abandonment rates to a minimum.
If you find an abandonment rate that is significantly greater than typical, you should investigate the page where it occurred. For example, sometimes consumers aren’t checking out because of technical difficulty (for example, the following page doesn’t load after they enter their address). Perhaps anything else, such as your delivery prices, swayed their decision.
- Scroll depth
You may use the scroll depth plugin to determine how far down your page visitors are scrolling. This Google Analytics tool calculates four scroll points: 25%, 50%, 75%, and 100% of the way down your page. When a user scrolls down to one of these points, Google Analytics sends an event, which is logged as a point of contact or engagement. You can track when visitors scroll down to specific components on your website in addition to seeing how far down people are scrolling (which might tell you how interesting your page is) (such as images or CTAs).
You can also examine the Google Analytics flow report to observe where people navigate or whether they drop off the site completely.
- Exit Rate
Exit pages are the final pages that people see before leaving your website. Because visitors can depart at any time, every page will have some sort of exit rate. However, you should monitor your web pages’ exit rates since a particularly high exit rate might indicate that something is wrong with that page. Some pages, such as “contact” and “thank you” pages, will always have a high exit rate. However, if the page was not intended to be an exit page yet has a high exit rate, it might be because:
- The website is crammed with information and is difficult to read.
- Due to the lack of a CTA, the visitor is unsure of where to proceed next.
- They departed because the page was having technical difficulties.
- Because the website is badly structured, the visitor cannot discover the CTA.
How do you measure engagement?
Complete customer engagement occurs when you have successfully engaged a visitor to the point where they convert — that is, they perform the desired action, such as providing you with personal information, contacting your company directly via your contact form (or by calling or emailing you), or making a purchase. The conversion rate statistic may be used to calculate the rate of complete engagement.
- Conversion rate
Conversions are the ultimate aim, although there might be several end goals. As a result, you should modify your conversion rate based on characteristics such as keyword conversion rate or marketing channel conversion rate. You may also keep a close eye on your total conversion rate, which will tell you how effective your attempts to convert visitors to your site have been. In the end, the greater your conversion rate, the better.
However, if you are creating distinct landing pages for certain markets, aim for a conversion rate of 5% or higher.
What are the metrics for search ranking?
Click-Through-Rate (CTR)
The percentage of searchers who visit your site after viewing one of your pages in search results is indicated by your CTR, or clickthrough rate.
For example, if ten separate individuals saw one of your sites appearing in Google’s results for a specific phrase but only one clicked and visited your site, your CTR would be 10%.
This metric is one of the most accurate indications of how well your sites capture consumers’ attention in search results.
As a result, it’s a good predictor of the quality of your site’s title tags and meta descriptions.
After all, when one of your sites appears in search results, these are the components that display — and they are what searchers use to decide whether or not to visit that page.
If your clickthrough rates are low, it might mean that your title tags and meta descriptions need to be improved.
Having said that, it is equally critical to realize the impact that rankings play in CTR.
After all, pages ranked first receive an average of 31.52% of clicks on a desktop results page and 24.05% of hits on a mobile results page.
Keyword rankings
This metric is easy to understand.
As you try to improve your site’s ranks for keywords that are essential to your business, it becomes sensible to keep track of how those rankings change. For some of your most essential terms, you may want to do this manually. After all, a quick Google search for those terms will tell you precisely where you stand.
However, you may receive a more complete view of your rankings by utilizing a service like SEMrush. If you open the Organic Search Positions report, for example, you’ll receive an overview of all the terms your site ranks for, as well as the positions in which it ranks.
Domain authority (DA)
One of the most essential aims of any SEO marketing strategy is to increase the site’s authority in the eyes of Google.
While attempting to measure this influence purely on earned links would be almost impossible, tools such as Website Authority Checker or built-in best-practice templates make the process straightforward.
Enter your site’s domain name, and you’ll get a number on a range of one to 100 indicating the authority of your site based on your backlink profile. Keeping an eye on this figure is a simple method to assess the effectiveness of your link-building plan and may help you see how your site’s reputation develops over time.
Bounce rate
A “bounce” occurs when a visitor visits a page on your site and then leaves without proceeding to another page. The percentage of visitors that do this is referred to as your “bounce rate.”
It’s also a good measure of whether your site’s content matches what visitors expect when they select one of your pages from a list of search results.
If a high number of your visitors leave your site and select a different page from the results, this indicates that the page they are arriving on does not offer the information that they want or need.
However, if your bounce rate stays low, you can be certain that your search-ranking pages are offering what your visitors want — and that those pages are assisting you in meeting your SEO objectives.
As marketers, we are constantly working to make our target audience happier. The net promoter score (or NPS) helps us to determine how satisfied they actually are. Improving NPS equates to increasing customer satisfaction.
Organic traffic
Organic traffic is an important metric for assessing SEO performance. This is because this figure reflects all of the traffic your site receives purely from organic search.
While total traffic figures might give you an indication of your site’s overall performance, focusing on organic traffic is a better method to assess the direct impact of your SEO strategy.
After all, one of the primary aims of any SEO plan is to raise your visibility in search results for terms related to your business and sector — and it stands to reason that if you’re successful, the number of visitors you get through search results should constantly rise.
And getting this data is simple with Google Analytics.
What is KPI in SEO?
KPIs for (SEO) Search Engine Optimization are values used by digital marketers to evaluate a website’s success in organic search results. Any marketing team’s main function is search engine optimization. It is critical for teams to analyze SEO KPIs and follow improvements month after month in order to truly understand their search marketing effectiveness. This study can assist in determining top-performing pages, top-converting keywords, and parts of your website that require search optimization.
Which Should You Rely On For Your Business?
Hopefully, this article has given you a better understanding of engagement metrics.
It may appear like there is a lot to benchmark and track, but monitoring these metrics will help you to evaluate how your website and marketing activities are doing and will give you a clear sense of what you need to fix to enhance customer engagement.
It is worth noting that there is no single statistic that is superior to the others – engagement metrics function best when used in tandem. You’ll receive the context you need to identify certain regions or concerns that need to be addressed if you use them together rather than alone. However, don’t get too engrossed in your data. After all, providing value to your target audience is the most effective method to engage them.
In case this sounds like an uphill task, reach out to us and we can help you with your critical SEO needs.
Hand off the toughest tasks in SEO, PPC, and content without compromising quality
Explore ServicesWritten by Jake Sheridan on November 21, 2021
Founder of Sheets for Marketers, I nerd out on automating parts of my work using Google Sheets. At Loganix I build products, and content marketing. There’s nothing like a well deserved drink after a busy day spreadsheeting.